GameStop Fever History
Unless you’ve been living under a rock over the past month, you likely have witnessed the mania around GameStop (“GME”), thanks in large part to social media darling, Keith Gill, who also is referred to, under his social media aliases, as “Roaring Kitty” and “Deep —-Value”. Gill (in)famously began the trend of purchasing “meme stocks”, which are stocks that are popular among retail investors but may not actually be a legitimate investment, in January 2021 when he began to cultivate a group of followers across his social media accounts to ultimately buy GME under the premise the company still had value amidst its significant short interest (i.e.: a large number of the company’s outstanding shares were sold short) from Hedge Fund managers. The idea would be to squeeze the Hedge Fund managers into covering their short positions, and thus, theoretically driving up GME’s price. Ultimately, it played out as expected for Gill and his followers as the price of GME surged over 1600% for the month of January 2021 from just under $5 per share to over $80 per share.
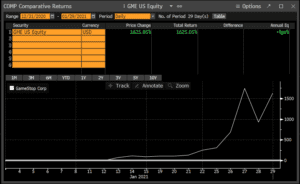
Source: Bloomberg – GameStop returns from 12/31/2020 through 01/31/2021.
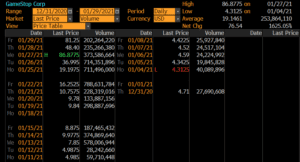
Source: Bloomberg – GameStop prices from 12/31/2020 through 01/31/2021.
Present Day Mania
Of course, the exuberance and price action around the stock fizzled out after January 2021 and began to decline and trade sideways between that point and the middle of May 2024, when Gill re-emerged on social media to illustrate that he began a large call position in GME with a 6/21/24 expiration date. Of course, this re-ignited the enthusiasm in the stock and once again created a short squeeze among Hedge Fund managers who were short the stock as GME’s price increased over 150% from just under $18 per share to over $48 per share in the two trading days following his posts on 5/12/24. As a result, Gill has become the center of attention among the industry, which is no easy feat considering the attention that has been focused on Artificial Intelligence and cryptocurrency.
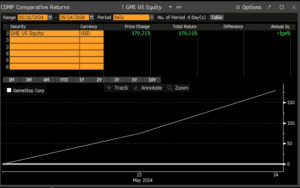
Source: Bloomberg – GameStop returns from 05/10/2024 through 05/14/2024

Source: Bloomberg – GameStop prices from 05/10/2024 through 05/14/2024
How do Meme Stocks relate to overall investing?
As the mania continues and potentially dwindles, it raises interesting concepts – risk management and generating alpha. Investors across all personas are always trying to generate additional return into their portfolios, which is why “meme stocks” can be so tantalizing. In fact, according to a research report published by S&P Dow Jones in April 2020, nearly 90% of equity funds underperformed the S&P 1500 and S&P 500, respectively, over the past 15 years.
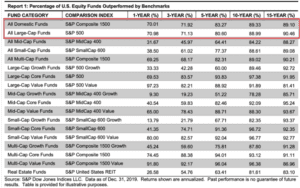
A conundrum
Therefore, we believe it’s fair to wonder – if professional asset managers struggle to beat traditional equity benchmarks, how is the average advisor or investor supposed to beat those benchmarks? For retail investors, they’ve decided to attempt to make speculative trades around meme stocks. For financial advisors, we have noticed that they’ve used several options overlay strategies to potentailly generate alpha. Both carry certain levels of risk, but what we have noticed is that oftentimes investors do not understand the exact level of risk they’re taking to generate additional return. As we have noticed from the above research, that risk does not produce compounded performance over traditional benchmark indexes.
What’s the solution?
In our estimation, we believe it’s important to adopt tools to specifically monitor and manage risk adjusted returns. This is not to say investors can’t or should not take risks. After all, part of investing involves levels of risk taking. However, investors need to understand how different asset classes and asset types cooperate with each other. In other words, increasing levels of diversification by building asset allocation models has
traditionally been a sustainable solution to crafting optimal portfolio outcomes. Of course, particularly in recent years, correlations across asset classes have diverged from historical norms. Therefore, we believe there are different ways in managing a portfolio. It does not necessarily need to be the traditional approach of region (U.S., ex U.S., emerging markets, etc.) plus asset type (equities, fixed income, commodities, currency, alternatives), but it does require a balance of correlation. To provide some context around balancing a portfolio, we ought to analyze correlations across a few different asset classes. The exercise is intended to exam a standard asset allocation matrix, but it can be applied with single stocks across multiple industries.
20 Year Asset Correlation
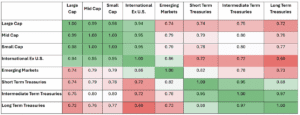
Source: Prices from Bloomberg from 6/1/2004 through 05/31/2024. “Large Cap” are prices for iShares S&P 500 ETF (“IVV”), “Mid Cap” are prices for iShares S&P Mid Cap ETF (“IJH”), “Small Cap” are prices for iShares S&P Small Cap ETF (“IJR”), “International Ex U.S.” are prices for iShares MSCI EAFE ETF (“EFA”), “Emerging Markets” are prices for iShares MSCI Emerging Markets ETF (“EEM”), “Short Term Treasuries” are prices for iShares 1-3 Year Treasury Bond ETF (“SHY”), “Intermediate Term Treasuries” are prices for iShares 7-10 Year Treasury Bond ETF (“IEF”), and “Long Term Treasuries” are prices for iShares 20+ Year Treasury Bond ETF (“TLT”).
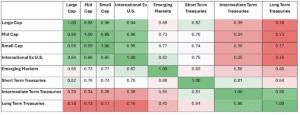
Source: Prices from Bloomberg from 6/1/2014 through 05/31/2024. “Large Cap” are prices for iShares S&P 500 ETF (“IVV”), “Mid Cap” are prices for iShares S&P Mid Cap ETF (“IJH”), “Small Cap” are prices for iShares S&P Small Cap ETF (“IJR”), “International Ex U.S.” are prices for iShares MSCI EAFE ETF (“EFA”), “Emerging Markets” are prices for iShares MSCI Emerging Markets ETF (“EEM”), “Short Term Treasuries” are prices for iShares 1-3 Year Treasury Bond ETF (“SHY”), “Intermediate Term Treasuries” are prices for iShares 7-10 Year Treasury Bond ETF (“IEF”), and “Long Term Treasuries” are prices for iShares 20+ Year Treasury Bond ETF (“TLT”).
5 Year Asset Correlation
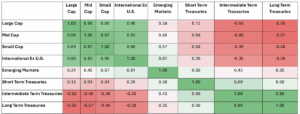
Source: Prices from Bloomberg from 6/1/2019 through 05/31/2024. “Large Cap” are prices for iShares S&P 500 ETF (“IVV”), “Mid Cap” are prices for iShares S&P Mid Cap ETF (“IJH”), “Small Cap” are prices for iShares S&P Small Cap ETF (“IJR”), “International Ex U.S.” are prices for iShares MSCI EAFE ETF (“EFA”), “Emerging Markets” are prices for iShares MSCI Emerging Markets ETF (“EEM”), “Short Term Treasuries” are prices for iShares 1-3 Year Treasury Bond ETF (“SHY”), “Intermediate Term Treasuries” are prices for iShares 7-10 Year Treasury Bond ETF (“IEF”), and “Long Term Treasuries” are prices for iShares 20+ Year Treasury Bond ETF (“TLT”).
What does this mean?
As we can see from the correlation matrix, there is significant divergence in correlation as you move along the asset class spectrum (i.e.: equities to fixed income). Further, we notice that correlations have dropped significantly in more recent periods compared to the long-term averages. In fact, we noticed that Emerging Markets have really decoupled themselves from domestic equities. However, the most notable change has been that treasury bonds have recently become negatively correlated with equities. We believe this is largely due to unprecedented monetary policy actions that were undertaken during, through, and in the wake of the COVID-19 pandemic. That said, we believe this divergence
in correlation represents an opportunity for investors to increase their levels of diversity while also taking positions of risk. Again, the above illustration was used to highlight a spectrum of diversification through established asset classes, but that can be across different types of stocks and/or other asset types. That is, we believe if an investor is interested in the prospects of a speculative stock like GameStop or a Cryptocurrency and can make an investment thesis for it, it may be appropriate to add it to their overall investment portfolio, assuming they can pair it against a larger asset allocation model that provides diversified return streams between that asset and the rest of their portfolio in order to manage the level of risk that the investor would be assuming within a particular asset.
Conclusion
Of course, this process can be both difficult to construct and difficult to manage. This is why we believe it is important for investors of any persona to adopt appropriate resources and applications to help construct and manage portfolios to both create diversified return streams and identify opportunities that can help add alpha to an investor’s portfolio. In our opinion, it’s important to not allow market mania to drive your investment decisions, but rather, understand its idiosyncrasies and how it can be used to your portfolio’s advantage.
Disclosure
All discussion regarding GME is for illustrative purposes only.
Not an offer: This document does not constitute advice or a recommendation or offer to sell or a solicitation to deal in any security or financial product. It is provided for information purposes only and on the understanding that the recipient has sufficient knowledge and experience to be able to understand and make their own evaluation of the proposals and services described herein, any risks associated therewith and any related legal, tax, accounting or other material considerations. To the extent that the reader has any questions regarding the applicability of any specific issue discussed above to their specific portfolio or situation, prospective investors are encouraged to consult with the professional advisor of their choosing.
Forward looking statements: Certain information contained herein constitutes “forward-looking statements,” which can be identified by the use of forward-looking terminology such as “may,” “will,” “should,” “expect,” “anticipate,” “project,” “estimate,” “intend,” “continue,” or “believe,” or the negatives thereof or other variations thereon or comparable terminology. Due to various risks and uncertainties, actual events, results or actual performance may differ materially from those reflected or contemplated in such forward-looking statements. Nothing contained herein may be relied upon as a guarantee, promise, assurance or a representation as to the future.
