While the dog days of August have just begun, the heat has seemingly spilled over into the markets. Global markets collectively suffered some of the most extreme volatility that we have ever witnessed. In fact, Monday (August 5, 2024) marked the second highest performance for the Chicago Board Options Exchange VIX Index dating back to January 1990.
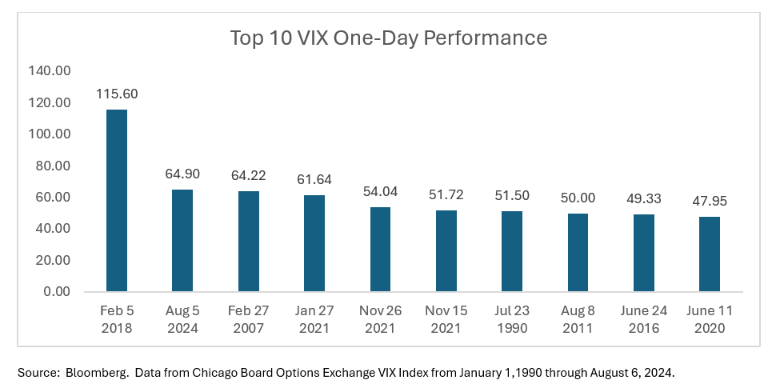
As we can see, Monday’s VIX action was greater than during the financial crisis periods (2007-2009) and the COVID-19 pandemic periods (2020-2021). Common themes among the top 10 VIX periods have been fears of economic recession and/or fears of increased interest rates. In the case of Monday, fears of both had emerged but in a slightly different manner. The U.S. jobs numbers for July were well below expectations, and thus, spiked unemployment higher than anticipated, which raised fears of an impending economic recession. However, the part that is interesting in this case is that U.S. interest rate cuts coupled with Japan interest rate hikes added fuel to the VIX fire. Because of the sour U.S. economic outlook, the market is raising expectations around how quickly and how much the Federal Reserve will cut interest rates. On the other side of the globe, concerns around the Japanese Yen continue to rise. Consequently, last Wednesday (July 31, 2024), the Bank of Japan announced it will raise interest rates 25 basis points.
How does U.S. rate cuts increase volatility?
In our opinion, the prospect of the U.S. potentially entering a recession will likely cause the Federal Reserve to cut interest rates at a greater magnitude and pace than the market originally anticipated. Meanwhile, the Bank of Japan is in the process of trying to stabilize the Japanese Yen by increasing interest rates. If the two nations go in the opposite direction with respect to monetary policy, this may have significant unintended consequences. Enter the reverse carry trade effect. The concept of the carry trade with the Japanese Yen took steam when the Federal Reserve began raising interest rates in March 2022. As rates began to rise in the U.S., while rates stayed around zero in Japan, it created the opportunity for investors to borrow Japanese Yen (at next to nothing) and purchase higher yielding U.S. assets. As a result, the Japanese Yen began to weaken versus the U.S. dollar to levels not seen in over 30 years.
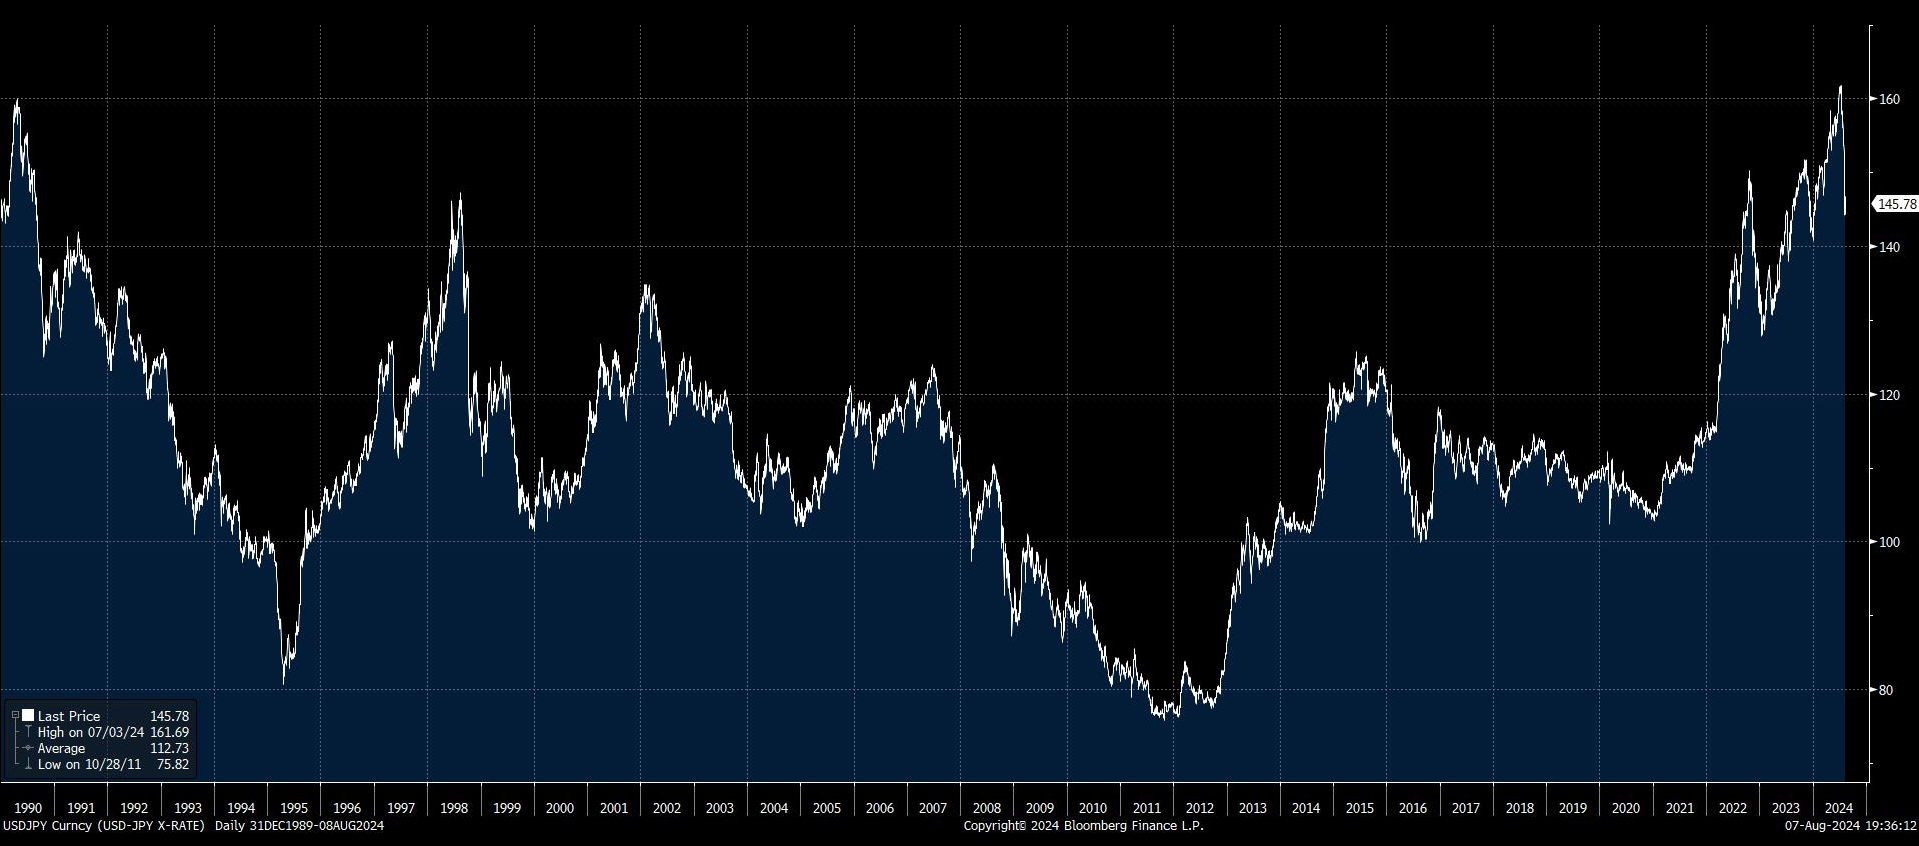
Source: Bloomberg. Japanese Yen per U.S. Dollar from 12/31/1989 through 08/08/2024.
As the chart shows, the Japanese Yen peaked over 160 Yen per U.S. dollar in late July 2024. As discussed, investors borrowed in Yen to purchase higher yielding assets in the U.S. However, as we noticed, investors were not just borrowing Yen to purchase U.S. treasuries; they were also buying high risk assets as well – namely, AI themed securities. However, after the Bank of Japan announced plans to raise interest rates, the Japanese Yen quickly plummeted, creating margin calls among investors borrowing the currency, which ultimately necessitated liquidation of U.S. assets to meet those margin calls. Consequently, the S&P 500 Index plummeted and the VIX began to spike.
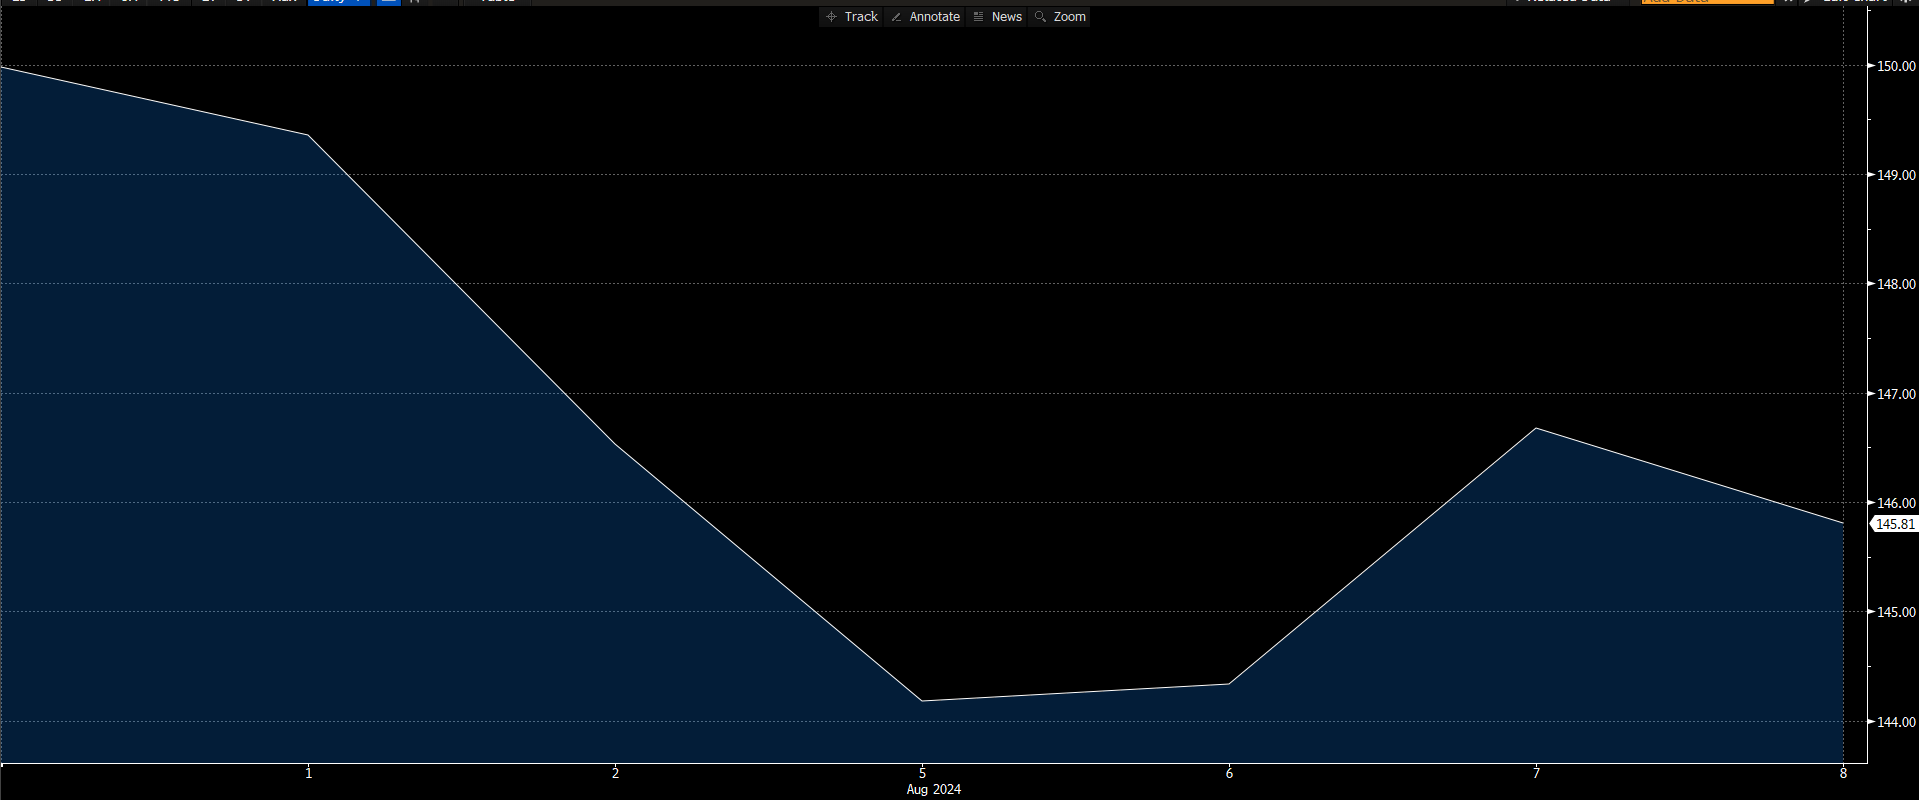
Source: Bloomberg. Japanese Yen per U.S. Dollar from 07/31/2024 through 08/08/2024.
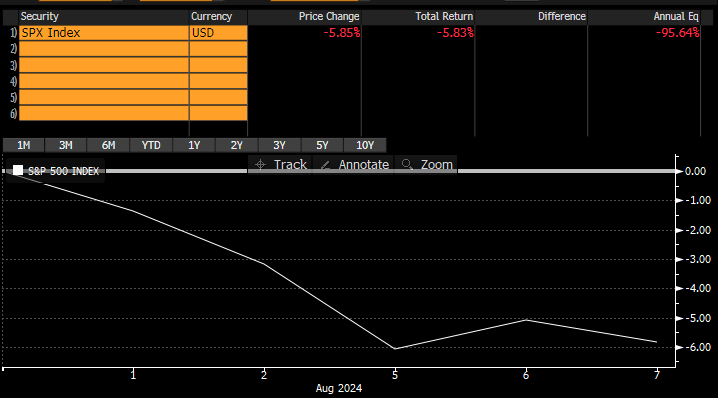
Source: Bloomberg. S&P 500 performance from 07/31/2024 through 08/08/2024.

Source: Bloomberg. VIX performance from 07/31/2024 through 08/08/2024.
While the prospects of a U.S. recession alone may cause a spike in the VIX, we believe the reversal of the Yen carry trade exacerbated volatility in the U.S. markets, thus carrying the VIX to record levels. We expect the Yen to continue to strengthen against the U.S. dollar, which may leave the U.S. markets unsettled for the time being.
What does an intense VIX spike mean for the markets looking ahead?
While the short-term effects of this kind of movement in the VIX can have devastating consequences, our research has indicated that it may present an opportunity.
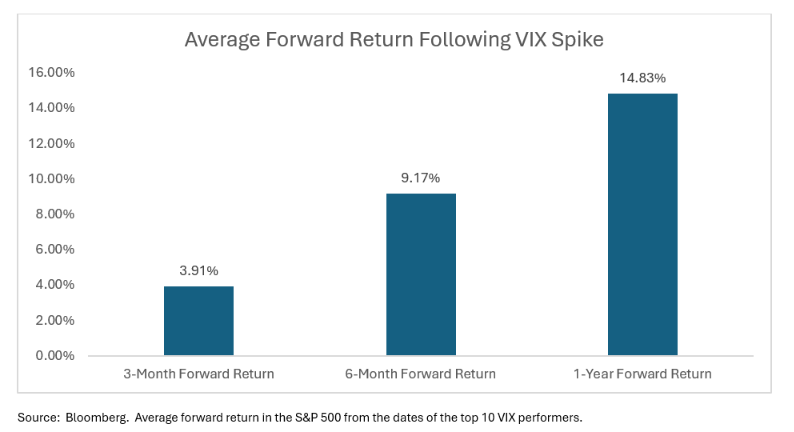
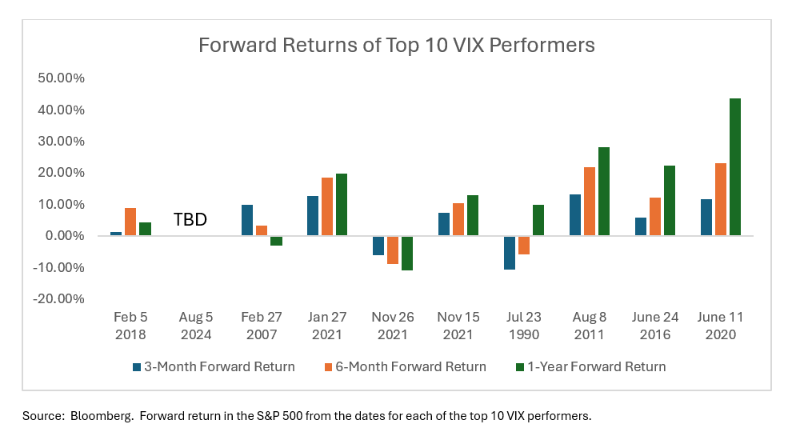
The first chart shows the average return series of the S&P 500 following the points from the top 10 VIX performance dates (with the exception of Monday, which is to be determined). As we can see, even near-term performance on average performed well coming out of a drastic spike in the VIX. Despite breaking out the periods themselves, all but two periods had a positive one-year return. The periods that experienced negative one-year returns were February 27, 2007, which was weighed down by the beginning of the financial crisis; and November 26, 2021, which was only months before the Federal Reserve began one of its most aggressive monetary tightening cycles after having completed one of its most accommodating monetary cycles.
Conclusion
Our read on this is that significant VIX spikes ordinarily have short-term negative consequences for market performance. In fact, the worst VIX spike observed over the period (February 5, 2018) experienced strong medium-term performance with a 6 month return of nearly 9% in the S&P 500 Index. In our opinion, its pedestrian one-year return was a result of an extreme drawdown during December 2018 as the Federal Reserve had announced its plan for additional, unforeseen interest rate hikes. We believe that coupled with increasing trade concerns between the U.S. and China sparked the significant drawdown for U.S. markets. The S&P 500 ultimately fell by more than 9% for December 2018. Of course, this runs in contrast to the current state of affairs, where the Federal Reserve is prepared to cut interest rates.
While there are outlier cases of prolonged pain felt throughout the markets following a significant VIX spike, we believe that the increased volatility in the markets right now is likely temporary and may lead to opportunities. That said, we also feel that in times of turbulence, proper portfolio construction and oversight is necessary. Although the data focuses on the S&P 500 Index returns, we believe it’s important to understand that the entire index’s performance may be driven by certain components and that there are other factors that may provide alpha coming out of market turbulence.
By: Justin Lowry, President & CIO
Disclosure
All discussion regarding the S&P 500 Index and the Chicago Board Options Exchange VIX Index are for illustrative purposes only.
Not an offer: This document does not constitute advice or a recommendation or offer to sell or a solicitation to deal in any security or financial product. It is provided for information purposes only and on the understanding that the recipient has sufficient knowledge and experience to be able to understand and make their own evaluation of the proposals and services described herein, any risks associated therewith and any related legal, tax, accounting or other material considerations. To the extent that the reader has any questions regarding the applicability of any specific issue discussed above to their specific portfolio or situation, prospective investors are encouraged to consult with the professional advisor of their choosing.
Forward looking statements: Certain information contained herein constitutes “forward-looking statements,” which can be identified by the use of forward-looking terminology such as “may,” “will,” “should,” “expect,” “anticipate,” “project,” “estimate,” “intend,” “continue,” or “believe,” or the negatives thereof or other variations thereon or comparable terminology. Due to various risks and uncertainties, actual events, results or actual performance may differ materially from those reflected or contemplated in such forward-looking statements. Nothing contained herein may be relied upon as a guarantee, promise, assurance or a representation as to the future.
