As of the date of this article (10/30/24), we are now inside one week from the U.S. Presidential election. Therefore, we believe it’s fair to wonder whether the outcome of the election matters for the markets. There’s no question that the battle for the top spot in the country, and arguably, the world, carries a level of significance. In fact, the two candidates have combined to raise nearly $1.5 billion. While we believe there are obvious stark contrasts in potential policies from each candidate, and that ultimately, those policies will affect parts of the economy differently if one candidate is elected over the other; we find it prudent to dig into exactly how the outcome may affect the financial markets. Therefore, we looked back at market returns coming out of Presidential cycles going back to 1996, which covers 4 democratic Presidential terms (Clinton’s final term, both of Obama’s terms, and Biden’s first term) and 3 republican Presidential terms (both of Bush’s terms and Trump’s first term).
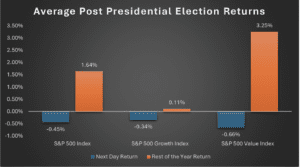
Source: Bloomberg return data. “Next Day Return” are the average returns in the day after the election from election cycles between 1996 and 2020. “Rest of Year Return” are the average returns from the day after the election through the end of the calendar year between 1996 and 2020.
The above chart illustrates how the S&P 500 core, growth, and value indexes performed in the days following the Presidential election since 1996. As we can see, the average one day return following the election does carry some level of volatility and has been traditionally to the downside as we believe investors may be derisking as they digest the outcome. The markets have ultimately ended up marginally up for the year, led by value. However, we feel it’s important to dig into the different possible outcomes and what that has historically meant for the markets. While the focus will be on the White House, we believe it’s just as important to focus on Congress to judge the likelihood of any potential legislation forthcoming. However, let’s just look at the Presidential outcome in isolation:
Republican Presidency
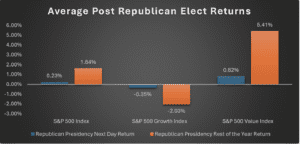
Source: Bloomberg return data. “Next Day Return” are the average returns in the day after the republican won the nomination from election cycles between 1996 and 2020. “Rest of Year Return” are the average returns from the day after the republican won the nomination through the end of the calendar year between 1996 and 2020.
Democrat Presidency
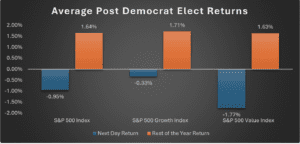
Source: Bloomberg return data. “Next Day Return” are the average returns in the day after the democrat won the nomination from election cycles between 1996 and 2020. “Rest of Year Return” are the average returns from the day after the democrat won the nomination through the end of the calendar year between 1996 and 2020.
At a glance, it would appear that there’s a stark contrast between the outcomes of each party. Value securities seem to respond quite negatively initially to a democrat nominee, while they appear to respond quite positively to a republican nominee. However, in both instances, on average, the market performed similarly between election day and the end of the calendar year when each party was nominated. We believe value stocks generally respond better to a republican President because republican policies have historically resulted in a more conducive economic environment for oil stocks, which have been traditionally value stocks. As mentioned, the Presidential outcome only paints part of the picture, so we need to examine how each party does within varying Congress regimes.
Republican Presidency with Divided Congress
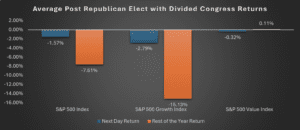
Source: Bloomberg return data. “Next Day Return” are the average returns in the day after the republican won the nomination and Congress was divided from election cycles between 1996 and 2020. “Rest of Year Return” are the average returns from the day after the republican won the nomination and Congress was divided through the end of the calendar year between 1996 and 2020.
Democrat Presidency with Divided Congress
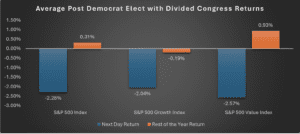
Source: Bloomberg return data. “Next Day Return” are the average returns in the day after the democrat won the nomination and Congress was divided from election cycles between 1996 and 2020. “Rest of Year Return” are the average returns from the day after the democrat won the nomination and Congress was divided through the end of the calendar year between 1996 and 2020.
Now things are getting interesting. As we can see above, the markets (at least initially) do not tend to like an outcome where the President elect has to deal with Congressional gridlock. In both instances where the party has to work with a divided Congress, the markets immediately moved sharply down. In the case where it was a republican presidency, the markets moved sharply down from election day through the end of the calendar year. The democrat presidency with a divided Congress was about flat in that same span. In our estimation, this is consistent with how the markets generally respond to any current event. That is, it does not like uncertainty. In our opinion, if the White House faces gridlock among Congress, it reduces clarity as to whether and to what extent particular legislation is passed. We believe an outcome of a divided Congress will likely lead to friction in the markets. Now that we have examined the possibility of a divided Congress, let’s take a look at how markets have responded when each party has enjoyed a cooperating Congress.
Republican Presidency with Republican Congress
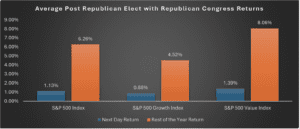
Source: Bloomberg return data. “Next Day Return” are the average returns in the day after the republican won the nomination and Congress was republican from election cycles between 1996 and 2020. “Rest of Year Return” are the average returns from the day after the republican won the nomination and Congress was republican through the end of the calendar year between 1996 and 2020.
Democrat Presidency with Democrat Congress
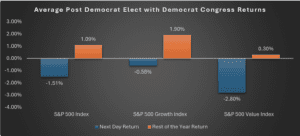
Source: Bloomberg return data. “Next Day Return” are the average returns in the day after the democrat won the nomination and Congress was democrat from election cycles between 1996 and 2020. “Rest of Year Return” are the average returns from the day after the democrat won the nomination and Congress was democrat through the end of the calendar year between 1996 and 2020.
As we can see, the initial market reaction is quite positive for an all republican White House and Congress, while an all democrat White House and Congress is quite negative. In both cases, the market did finish up from the election through the remainder of the calendar year, but it was much higher for an all republican outcome. As we have discussed, value securities seem to heavily favor the all republican outcome, which is in line with our expectations as republican based policies are generally more favorable to the oil industry. Additionally, we believe the markets may have historically reacted more favorably to an all republican outcome because republicans have historically enacted policies that provide more favorable taxation on corporations as well as reduce regulation. On the contrary, democrats have historically enacted policies that may increase corporate taxation as well as increase regulation. While these are general ideologies and may not exactly bear out, it does appear to be a sentiment held by the financial markets. The final potential outcome would be a President elect working with an opposing party Congress. Since 1996, a republican President has not had a fully democratic Congress; therefore, we will just examine the instances where a democrat President had a fully republican Congress.
Democrat Presidency with Republican Congress
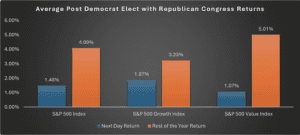
Source: Bloomberg return data. “Next Day Return” are the average returns in the day after the democrat won the nomination and Congress was republican from election cycles between 1996 and 2020. “Rest of Year Return” are the average returns from the day after the democrat won the nomination and Congress was republican through the end of the calendar year between 1996 and 2020.
As we can see, a democrat elect coupled with an all republican Congress has historically been viewed quite positively by the markets. This is generally in line with our expectations as financial markets view both political parties operating in cooperation with eachother and likely weeding out extreme agendas from either side. While this outcome could be viewed similar to a divided Congress and potentially result in gridlock, the markets have historically seen this outcome as conducive to passing positive legislation for corporations.
Through our analysis, we believe we can answer the question as to whether the election matters for financial markets. Based on our findings, we should expect markets to have some level of volatility, regardless of the winner. Additionally, we expect markets to react negatively to a divided Congress, regardless of the President elect. Lastly, it would seem that an all republican Congress is seen as most positive for markets, regardless of the President elect. Again, we believe an all republican Congress is likely seen as a positive given that republican legislatures generally put forth legislation that is considered “pro-business”, and thus, would be positive for publicly traded corporations. Therefore, we believe we can conclude that the President elect does not carry as much significance as Congressional make up. Either way, we believe the election will likely provide some level of volatility.
Disclosure
All discussion regarding the S&P 500 Index, the S&P 500 Growth Index, and the S&P 500 Value Index are for illustrative purposes only.
Not an offer: This document does not constitute advice or a recommendation or offer to sell or a solicitation to deal in any security or financial product. It is provided for information purposes only and on the understanding that the recipient has sufficient knowledge and experience to be able to understand and make their own evaluation of the proposals and services described herein, any risks associated therewith and any related legal, tax, accounting or other material considerations. To the extent that the reader has any questions regarding the applicability of any specific issue discussed above to their specific portfolio or situation, prospective investors are encouraged to consult with the professional advisor of their choosing.
Forward looking statements: Certain information contained herein constitutes “forward-looking statements,” which can be identified by the use of forward-looking terminology such as “may,” “will,” “should,” “expect,” “anticipate,” “project,” “estimate,” “intend,” “continue,” or “believe,” or the negatives thereof or other variations thereon or comparable terminology. Due to various risks and uncertainties, actual events, results or actual performance may differ materially from those reflected or contemplated in such forward-looking statements. Nothing contained herein may be relied upon as a guarantee, promise, assurance or a representation as to the future.
Certain information contained herein has been obtained from third party sources and such information has not been independently verified by Global Beta Advisors, LLC. No representation, warranty, or undertaking, expressed or implied, is given to the accuracy or completeness of such information by Global Beta Advisors, LLC or any other person. While such sources are believed to be reliable, Global Beta Advisors, LLC does not assume any responsibility for the accuracy or completeness of such information. Global Beta Advisors, LLC does not undertake any obligation to update the information contained herein as of any future date.
