
As many investors may have noticed, Nvidia (“NVDA”) just reported an astonishing earnings report on Thursday (2/22/24). With the recent surge in NVDA’s performance and its bubbling valuations, we believe it’s fair to wonder if NVDA may just be the leader of yet another bubble. We have noticed that many financial professionals associate NVDA with some of the tech darlings of the “dot com” tech bubble and worry that NVDA may fall to the same fate as those stocks did. We believe history is an important indicator as to what we’re currently experiencing and where we may go, however, it’s always important to factor in the differences between now and history as well. Let’s first identify the parallels between NVDA and its “dot com” peers. Two stocks that were two of the larger performers in the S&P 500 Index during the “dot com” bubble were Oracle (“ORCL”) and Cisco (“CSCO”). We believe the peak of the “dot com” bubble spanned from 1998 through the third quarter of 2000. After experiencing negative performance in 2022, we have noticed that NVDA has been achieving exponential return growth from the beginning of 2023 through its recent earnings report on 2/22/24, thanks in large part to their development of graphic processing units (“GPUs”) and the demand surrounding those GPUs to power AI related applications.
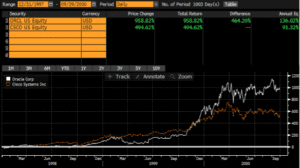
Source: Bloomberg. Returns from 12/31/1997 through 09/29/2000. Past performance is not indicative of future results
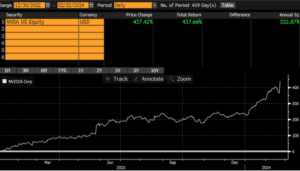
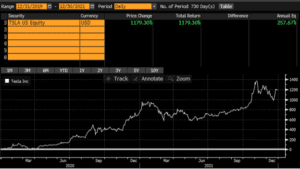
Source: Bloomberg. Returns from 12/31/2022 through 02/21/2024. Past performance is not indicative of future results
The above charts appear to illustrate an interesting parallel between ORCL and CSCO during the “dot com” bubble and present day NVDA. In fact, NVDA has accumulated approximately 1/3 of the return growth that ORCL experienced in approximately 1/3 of the time. Of course, this does not imply a linear relationship will continue over the next two years, but it does strike a compelling resemblance and one that has sounded the alarm bells for some investment professionals.
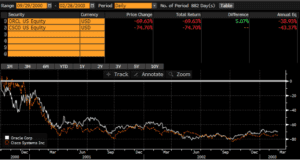
Source: Bloomberg. Returns from 09/29/2000 through 02/28/2003. Past performance is not indicative of future results
As we can see, the performance for ORCL and CSCO dropped precipitously over the following two and a half years. We have found that 02/28/2003 was approximately the point in time where the S&P 500 Index bottomed during its bear market sell-off from August of 2000, which is the basis for measuring over this period. We believe that the stocks ran up too much too fast and their financials simply did not justify their respective stock prices. Additionally, we believe their products and solutions provided too short term of solutions and were susceptible to market competition. In fact, this is where we believe the parallels begin to diverge. While we observed that valuations increased for all stocks, we believe it’s important to discern as to why this is occurring – is it sentiment and momentum or is it based on financials? In our opinion, the former is generally short lived and susceptible to significant corrections, however, the latter typically tends to be more durable.
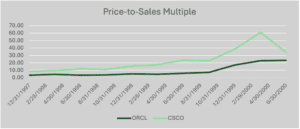
Source: Bloomberg. Quarterly price-to-sales multiples from 12/31/1997 through 09/29/2000.
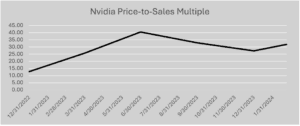
Source: Bloomberg. Quarterly price-to-sales multiples from 12/31/2022 through 02/22/2024.
As shown in the illustrations above, all three stocks soared to very high price-to-sales multiples in their respective periods. In our experience, if a stock is going to rise to a price-to-sales multiple of 20 or greater; their growth rates must be borderline meteoric to sustain those multiples. In our opinion, growth rates of 20-30% will not justify those multiples. We believe stocks need to experience growth rates in the triple digits to warrant those kinds of multiples.
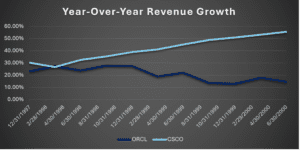
Source: Bloomberg. Year-Over-Year revenue growth rates from 12/31/1997 through 09/29/2000. Past performance is not indicative of future results
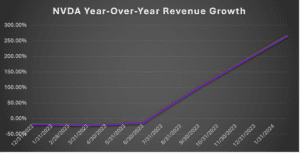
Source: Bloomberg. Year-Over-Year revenue growth rates from 12/31/2022 through 02/22/2024.
While ORCL’s and CSCO’s growth rates were good, we do not believe they were great, and to justify high price-to-sales multiples, we believe your growth rates need to be nearly unprecedented. In the case of NVDA, we believe they enjoyed unprecedented growth. As we can see above, with its most recent earnings report, NVDA now has three quarters in a row of triple digit year-over-year growth rates, including its most recent year-over-year growth rate of 265%. Of course, we believe these year-over-year growth rates will likely begin to level off over the next 12-18 months, however, the continued trajectory of growth may be here to stay and indeed may make NVDA different from its peers of the past.
If we wanted to draw a comparison to a more contemporary peer, we do not have to look further than the “magnificent 7” (Meta, Apple, Microsoft, Tesla, Nvidia, Alphabet, and Amazon). It has only been about 4 years since we saw Tesla experience tremendous return growth on the heels of the emergence in electric and autonomous vehicles.
Source: Bloomberg. Returns from 12/31/2019 through 12/31/2021. Past performance is not indicative of future results
We believe that the calendar years of 2020 and 2021 were the peak of Tesla’s (“TSLA”) phenomenon. As we can see, TSLA’s performance trumped both ORCL and CSCO during their peak.
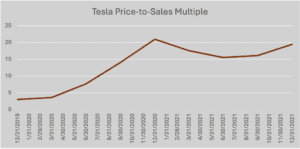
Source: Bloomberg. Quarterly price-to-sales multiples from 12/31/2019 through 12/31/2021.
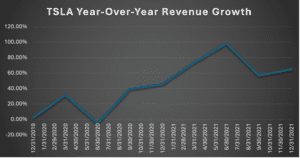
Source: Bloomberg. Year-Over-Year revenue growth rates from 12/31/2019 through 12/31/2021.
As we can see, TSLA’s price-to-sales multiple ran up to levels similar to CSCO and ORCL, however, while its peak revenue growth rates were higher than both of those securities, it never reach the triple digit mark like NVDA. It should be noted that we believe TSLA’s growth was very good, but as we discussed, companies need to achieve and sustain triple digit level growth rates to justify these kinds of multiples. As such, TSLA has fallen victim to the same fate as CSCO and ORCL.
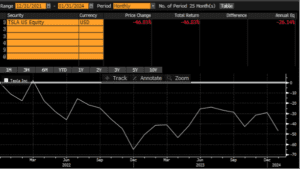
Source: Bloomberg. Returns from 12/31/2021 through 01/31/2024. Past performance is not indicative of future results
This circles back to our initial question – is Nvidia different? In many ways, the similarities are glaring between NVDA and CSCO, ORCL, and even TSLA. However, the milestone that NVDA has hit that the other three have not – sustained triple digit growth rates. While we do not believe this may persist indefinitely, the company appears to have a strangle hold on the GPU market share, which we believe is the lynchpin in the development of AI based applications. While NVDA will likely face increased competition, we believe the pie will likely grow more than NVDA loses market share. In our opinion, NVDA, as well as other AI related companies, will be ones to watch as we move forward over the next 12-18 months.
Disclosure
Specific investments described herein do not represent all investment decisions made by Standard and Poor’s. The reader should not assume that investment decisions identified and discussed were or will be profitable. Specific investment advice references provided herein are for illustrative purposes only and are not necessarily representative of investments that will be made in the future.
This information is provided solely as general information about the S&P 500 Index and its underlying components and to otherwise provide general investment education. None of the information provided should be regarded as a suggestion to engage in or refrain from any investment related course of action. Investing involves risk and loss of principal is possible.