
As we have observed over nearly the first two months of the calendar year, the market is on a roll, so much so that investors may be wondering when the other shoe will drop. It has certainly been great start to the year for the S&P 500 as it is up 7.11 in just the first two months of 2024.
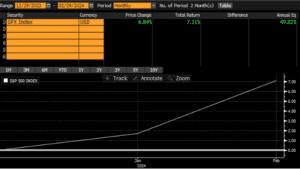
Source: Returns from Bloomberg, 12/31/2023 through 2/29/24.
The strong start has largely been fueled by strong earnings, particularly among stocks that carry some of the largest weights in the S&P 500 – Meta Platforms (“META”) and Nvidia (“NVDA”). However, the run up may come with signs of caution as the S&P 500 recently hit an all-time high, closing at 5,088.80 on 2/23/24. Consequently, we are also seeing its price-to-sales multiple creep higher.
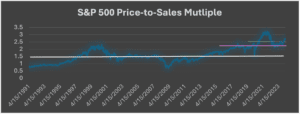
Source: Data from Bloomberg. Daily data from 4/15/91 through 2/29/24. White line indicates average price-to-sales multiple over entire time frame. Purple line indicates 10-year average. Green line indicates 5-year average.
As we can see, the S&P 500’s current price-to-sales multiple is above its long-term average (white line), its 10-year average (purple line), and its 5-year average (green line), although its still shy of its pandemic highs of 2020 into early 2021. While we believe stretched valuations can lead to the market being vulnerable to a correction (i.e.: a decline of 10% or greater from a recent all-time high), it’s not the only consideration. We have noticed that stock market momentum is a serious factor in times like these. In fact, when the S&P 500 has a strong start to the year, we have noticed that it generally has a strong calendar year.
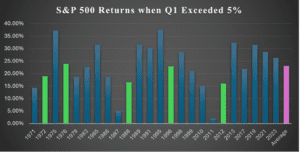
Source: Data from Bloomberg. Calendar year returns during years when the S&P 500’s first quarter return was 5% or higher. Green bars represent election years. The purple bar indicates the average.
The above chart illustrates the calendar years, dating back to 1970, in which the S&P 500 had a 5% or greater return in its first calendar quarter. The average calendar year return in those years was approximately 23%. Five of those calendar years were election years (as is the case in 2024), which averaged an approximate 20% return for the calendar year. In our view, the outlier years were 1987 and 2011. In 2011, we witnessed a downgrade in the U.S. credit rating and global concerns over a credit crisis. In 1987, investors experienced one of the worst single day trading sell offs in history, “Black Monday”, which largely contributed to that year’s stumble. In both outlier cases, it took a “Black Swan Event” (i.e.: an unpredictable event with extraordinary ramifications) to curtail the momentum in those markets. Therefore, it’s fair to wonder – does 2024 compare or contrast to those outlier periods? Some economists may say that there are credit concerns now, and that a credit event could occur. Additionally, market participants may indicate that a large correction may be due, given current valuations in the market. However, there is nothing concrete to suggest that either a credit event or a major correction is on the horizon. The U.S. seems to be content with continuing to print money to pay its debt and investors seems to agree that U.S. debt is some of the most appealing debt globally. Meanwhile, unlike 1987, the Federal Reserve is far more likely to cut interest rates versus raising interest rates like they did then. Of course, the market is routinely unpredictable, so in our estimation, investors must apply probability with preparations for worse-case-scenarios in making their determinations.
However, we have noticed that momentum cannot carry a market forever. In fact, we believe momentum is normally short-lived because investors generally begin to take investment profits if they do not foresee continued corporate value being added. In fact, the same history suggests the following year does not fair quite as well.
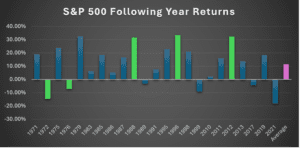
Source: Data from Bloomberg. Following calendar year returns during years when the S&P 500’s first quarter return was 5% or higher. Green bars represent election years. The purple bar indicates the average.
As we can see in the above chart, we look at how the S&P 500 calendar year returns performed in the following year. This illustration is much more of a mixed bag. The average following year return is less than half of the current calendar year, and there are far fewer calendar years that performed well in the following year. However, the 3 recent election years (1988, 1996, and 2012) had following year returns of 30% or higher. However, as we learned above, 1987 and 2011 were the outlier years. Additionally, 1996 was only the beginning of the “dot com tech” bubble, so it’s difficult to draw much of a comparison between those years and 2024. As such, we believe that performance in 2025 will not be carried by momentum, but rather, will need financially led catalysts, such as continued strong corporate earnings and/or accommodative monetary.
As we look ahead for 2024, although geopolitical and credit events are headwinds for the market; there are tailwinds, such as the prospect of continued corporate earnings growth, as achieved in Q4, as well as more accommodative than expected monetary policy. Ultimately, we believe the fate of 2024 will be driven by market momentum.
Disclosure
Specific investments described herein do not represent all investment decisions made by Standard and Poor’s. The reader should not assume that investment decisions identified and discussed were or will be profitable. Specific investment advice references provided herein are for illustrative purposes only and are not necessarily representative of investments that will be made in the future.
The S&P 500 is an index of the 500 largest stocks in the U.S. market, calculated and administered by Standard and Poor’s.
This information is provided solely as general information about the S&P 500 Index and its underlying components and to otherwise provide general investment education. None of the information provided should be regarded as a suggestion to engage in or refrain from any investment related course of action. Investing involves risk and loss of principal is possible. Past performance is not indicative of future results.